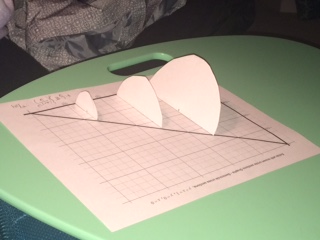
This week, we started learning about Cross Sections. Cross sections are another way to find the area of a shape using a graph. It has the same idea as the previous rotation methods that we have learned, but does a few things differently. We did an activity in class that was supposed to help us visualize this, but as I missed the first part of the lesson, I struggled with it in the beginning. In the activity, we cut out squares and put them on a graph that we were given, to see how square cross sections work. This allowed us to see that we can take a side length and square it, and then use the functions that are given to create an integral that will allow us to solve. The idea is the same with semicircle cross sections. Use the functions given, and the area formula for a semicircle to make an integral and solve to get the area. While I didn’t understand it perfectly at first, I slowly started to grasp it, and I think that the visual we made helped more as I began to understand the concept better. At first I didn’t really understand why we were putting random squares on our graph but then things started to connect. I’m really excited that this is one of the last things that we will be learning!
We’ve reached trimester 3! Last week we took the tri 2 exam, and I am super glad to be done with that trimester. We started this trimester by continuing to learn about the various methods that are used to find the area of a graph rotated around an axis. The shell method was the main idea this week, and I think this is my favorite one so far. It seems to be the easiest. It is pretty similar to the washer method, except it has a few minor changes to the formula. With the shell method, you multiply the integral by 2pi which is different than previous formulas, and you multiply the function by x, which represents the distance from the origin to the center of rotation. With previous methods we had to square parts of the function or things like that, so just multiplying by x makes the shell method the easiest in my opinion. It still shares the same idea of rotating things around an axis and finding their area or volume, but takes fewer steps. Both the worksheet and the assignment went well for me when working with this method, so hopefully things continue that way. I feel like I understand all of the methods fairly well, but my fear is that I will confuse them and all of their different parts when it comes to being tested on it. That is something that I will definitely have to work on.
https://www.khanacademy.org/math/integral-calculus/solid_revolution_topic/shell-method/v/shell-method-for-rotating-around-vertical-line This week, we continued working on chapter seven. In the last two weeks of school we had three snow days, so it was a little difficult trying to remember everything that we were working on. I know at one point we all were really confused and stressed out over a worksheet that we had, especially because we thought we had a quiz coming the next day, but eventually things started to make sense and we got everything figured out. This week we learned how to find the area between two curves in a plane. This can be done by graphing the two functions given, and finding their intersection points. Once you have those, you can use the intersection points as the bounds for a definite integral, and then solve the integral to get the area. Some of the more complicated problems require different things like integrating with respect to y instead of x, or using partitions to solve. No matter what way you solve, this is a useful skill because before we could find the area between a curve and an axis, but now we can find the area between two separate curves.
This week we continued with chapter six, and began working on Separable Differential Equations. This week was a little bit hard for me because I missed a day and a half of school. Even though I technically only missed one day of math, it still feels like I missed a whole week's worth of material. Luckily, the topic we learned this week was relatively easy for me to understand. When working with separable differential equations, you are given the derivative of a function, and you are supposed to find the original function. You do this by separating the variables, making one on each side, and then using integrals to find the antiderivative of each side. Once you have found the original equation, you can use outside information and plug it to solve different questions. We used this mainly in exponential growth or decay situations. Learning this topic took up the first part of the week, in the second half we reviewed and took the chapter six test. For the last couple of chapter tests we have been taking a multiple choice portion, and a free response portion, which I have really enjoyed. I like the idea of taking two separate tests, because it gives us more time to study, and more time when taking the actual test. It just make things easier in my opinion, and less stressful, even if it seems like we are taking two tests.
This week, we finished learning about u-substitution, and started working on slope fields. Slope fields are actually really simple, and I like them a lot more than u-substitution. Slope fields are cool because you don’t actually have to solve the function that is given, you can just go to each individual point and find the solution there. Sometimes it is a longer process when you have a complicated function, and that can be a little frustrating and tedious, but generally the equations are pretty nice so it doesn’t take too long to plug x and y in to get a number. Say you have x+y as the function you are working with; to solve, you would just pick a point on a graph like (1,1) and plug it in. In this case 1+1=2 so we know that there is a slope of 2 at that point. You could continue to use that method until you know the slope of every point on the graph. When you draw the slope for every point, it gives a representation of what the graph of the function looks like. It’s kind of fun to see what the graph turns out to be as you add more points because you can start to compare what you know the graph should look like to what you are actually drawing.
This week we started working on u-substitution with definite and indefinite integrals. I think chapter five was my favorite so far, so I was really hopeful for starting chapter six. When I found out we would be doing u-substitution again, my first reaction was to panic but it actually wasn’t as bad as I thought it was going to be. I think this time around it was actually easier, because I have gotten used to working with derivatives and u-substitution in the past chapters. It is still a harder topic for me, but much easier than the last time we did it. I have learned that I like doing u-substitution with definite integrals a lot better than with indefinite integrals. I think it makes more sense to me because with definite integrals you are given bounds and can solve for a specific value. I know that it is basically the same process for both, but for some reason I really like being able to plug numbers in and actually get an answer. Overall, I feel pretty good about this week and I hope that next week will be as easy.
https://www.khanacademy.org/math/integral-calculus/integration-techniques/u_substitution/v/u-substitution When learning the Fundamental Theorem of Calculus, I think I relied more on deductive learning. I understood it much better when I was shown the proof and it was explained to me, and then reinforced through examples. When we did the activity on Friday, I understood the questions and sort of got what we were doing, but it all really connected for me after seeing the proofs and having it thoroughly explained. I think this theorem is so fundamental because it really shows how the derivative, the antiderivative and integrals are related. We have been working a lot with derivatives and while they have been useful before, this proves to me how important they really are. The theorem ended up being much more simple than I thought it would be and I think I understand it pretty well.
This week we started Chapter 5, and began learning about Definite Integrals. All I know is that I am so glad to be done with Chapter 4 and optimization. I find definite integrals way more interesting and so far have really liked working with them. We use definite integrals to find the area under a curved function. When we graph functions that give us straight lines, we are able to find the area of that shape by using simple area formulas like a=½ bh, but when we graph functions like y=x^2, it’s impossible to find the exact area under the function with basic formulas. Instead of trying to find the area of one shape, we try to add up an infinite number of rectangles that can be drawn under the curve between the given bounds. Definite Integrals allow us to do that. Throughout the week we learned different rules for integrals that showed us how to add/subtract them, multiply them and more. We also learned how to evaluate definite integrals using the antiderivative. When you take the antiderivative of the function, you can plug in the bounds for x, and then solve to get the area. Overall, I feel pretty good about my understanding of this topic so far. Here is a Khan Academy that shows what I tried to explain earlier.
https://www.khanacademy.org/math/integral-calculus/indefinite-definite-integrals/definite_integrals/v/evaluating-simple-definite-integral This week, we learned about Optimization. With optimization, we basically had to read a word problem and then use the given information to maximize (or sometimes minimize) whatever the question was asking for. The problems had to do with things like “Find how big of a gate we can make while using the smallest amount of materials” or “what are the dimensions of the biggest rectangle that can fit into this circle.” To solve these problems, we were taught a simple strategy: Develop a model, take the derivative to find the critical points, and then solve the model. This really is not difficult, and I understood the strategy easily. When it came to the actual execution of the strategy, I failed miserably. The problem was always developing the model. I completely understood how to solve things and get the answers once I had the equations, but if I didn’t know how to set it up, it was impossible for me to solve it. I remember doing sections in past math classes that were similar to this -using word problems to make equations and then solving- and I was really bad at it then too. I think I struggle because generally I can’t visualize what the problem is asking for, and I have to have someone explain it to me. I don’t think this is something that I will ever be great at, but I can definitely work to be better at it than I am now. We finished up the week with related rates, and those don’t seem very hard, but they also require me to visualize what is happening, so hopefully I will be okay. We did some whiteboarding on Friday to work on those, along with other practice problems and I think I understood that pretty well.
I really enjoyed class this week because I felt like I was able to put everything we’ve learned together. In the beginning of the week we learned curve sketching and then to finish the week we started learning about optimization. I really enjoyed the curve sketching because to me it felt like a big puzzle. We had to figure out all of these small parts and eventually used them to find the graph of the original function. When we learned all of the parts individually, I didn’t really know what was going on. Before Thanksgiving we went by sections learning increasing and decreasing, concave up and down, and all the different parts, but at that point I wasn’t understanding what we were doing. This week, when we put all the pieces together, it clicked for me. I think the thing that helped was the graph gallery walk. It didn’t take very long, but it was very beneficial for me. Each graph asked us a different question that related to seeing values on either the original function, or the derivative. So basically, we were given a graph, and we had to visualize another one based on what we were given, and then answer a question about it. Generally, I am horrible at that kind of thing. I would normally have to sit down and draw everything out and it would take me 5 minutes, but with this activity we only had 20 seconds. At first I was horrible at it but after a couple graphs, I became much quicker at it and started understanding how both graphs related. This was a super helpful activity and loved it. Analyzing the graphs helped a ton when it came to understanding the curve sketching and made the rest of the week much easier. I love that we do different activities like this to help us learn instead of just taking notes and doing an assignment everyday.
(I know that this picture is of random young children, but I forgot to take a picture of our gallery walk when we did it, and this is kind of the same idea.) |
|